|
EXAMPLE OF SIMPLEX PROCEDURE
FOR A STANDARD
LINEAR PROGRAMMING PROBLEM |
|
Below is the
original problem:
objective function
is in green. |
|
|
Red variables below
are called
SLACK VARIABLES |
|
|
Below is the
SIMPLEX TABLEAU.
Compare RED symbols
with Z = x1 + 2x2 - x3.
Highlighted below
is the "ISM". |
|
 |
The 1st SIMPLEX TABLEAU
is below. (credit Steve Hulet) Note
missing z-column
Highlighted is the "ISM" |
|
See steps 3,4,5 of
SIMPLEX METHOD
as you handle INDICATORS,
RATIOS, and PIVOTS. |
Named below are the 4
row operations needed to
pivot on the number
"5" encircled in red |
|
 |
Below are the
results of the
row operations
named above |
highlighted
is the
new ISM |
|
Since one INDICATOR
(namely -1/5) remains
negative, we must
repeat steps 3-9 |
|
Below is the result
of changing our pivot
to "1" |
|
Named below are
4 row operations
needed to pivot
on the number(16/5)
encircled in red |
|
 |
Above there was a tie for least non-negative ratio:
either row 1 or row 2 could have become the pivot row,
and either choice leads to the final tableau after one
additional pivoting. At the right is the result of the
final 3 row operations. "ISM" is highlighted |
|
|
 |
|
All indicators {0, 0, |
49
16 |
, 0, |
1
16 |
and
|
3
8 |
} are now zero or bigger ("13" is NOT an indicator). |
|
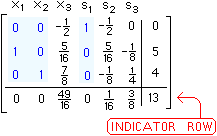
Thus, as in step 8 of the SIMPLEX METHOD, the last tableau is a FINAL TABLEAU. |
|
Row operations of SIMPLEX METHOD are done. |
Thus, the basic solution
for the tableau above is the solution to our original
problem.
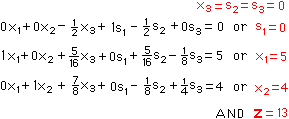
[1st] set equal to 0 all variables NOT associated with the above
highlighted ISM. The columns
of the final tableau have variable tags.
[2nd] convert each row of the final tableau (except the
bottom row) back into equation form (as at the right) to
find the values of the remaining variables. The value of the
objective function is in the lower right corner of the final tableau. |
|
 |
 |
|
 |
This page last updated
6 March 2016 |
|


